
0
View Comments
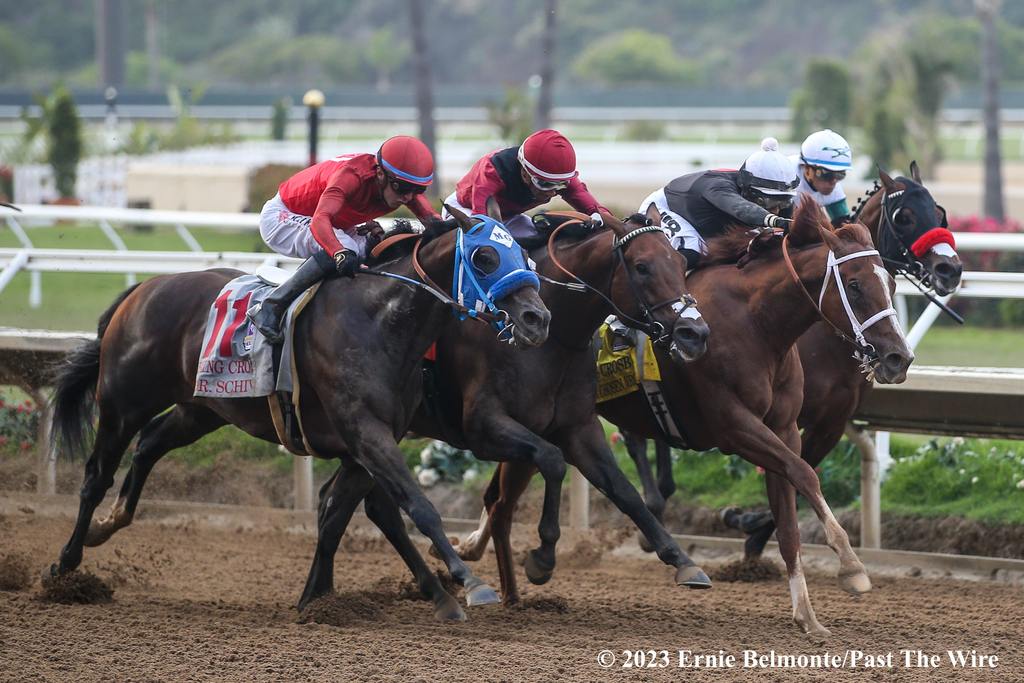
The Chosen Vron (#4) battling for the victory in the Grade 1 Bing Crosby at Del Mar. (Ernie Belmonte/Past The Wire)
Equibase Release
Wagering on U.S. Races was down almost seven percent comparing July 2022 and July 2023. Handle was down over three and a half percent year-to-date.
Field size remains steady at an average of seven entries. However, the number of starts is down almost five percent compared to July 2022 and just under two percent year-to-date.
Thoroughbred Racing Economic Indicators
For July 2023
| July 2023 vs. July 2022 | |||
| Indicator | July 2023 | July 2022 | % Change |
| Wagering on U.S. Races* | $1,067,688,807 | $1,144,093,082 | -6.68% |
| U.S. Purses (Available) | $123,332,940 | $124,707,637 | -1.10% |
| U.S. Purses (Paid) | $117,565,157 | $120,554,125 | -2.48% |
| U.S. Race Days | 423 | 453 | -6.62% |
| U.S. Races | 3,316 | 3,535 | -6.20% |
| U.S. Starts | 23,372 | 24,524 | -4.70% |
| Average Field Size | 7.05 | 6.94 | +1.60% |
| Average Wagering Per Race Day | $2,524,087 | $2,525,592 | -0.06% |
| Average Available Purses Per Race Day | $291,567 | $266,124 | +9.56% |
| YTD 2023 vs. YTD 2022 | |||
| Indicator | YTD 2023 | YTD 2022 | % Change |
| Wagering on U.S. Races* | $7,142,167,324 | $7,406,712,307 | -3.57% |
| U.S. Purses (Available) | $722,130,308 | $713,435,900 | +1.22% |
| U.S. Purses (Paid) | $693,924,397 | $687,611,733 | +0.92% |
| U.S. Race Days | 2,284 | 2,382 | -4.11% |
| U.S. Races | 18,730 | 19,405 | -3.48% |
| U.S. Starts | 137,177 | 139,538 | -1.69% |
| Average Field Size | 7.32 | 7.19 | +1.85% |
| Average Wagering Per Race Day | $3,127,043 | $3,109,451 | +0.57% |
| Average Available Purses Per Race Day | $316,169 | $288,670 | +9.53% |
* Includes worldwide commingled wagering on U.S. races.