0
View Comments

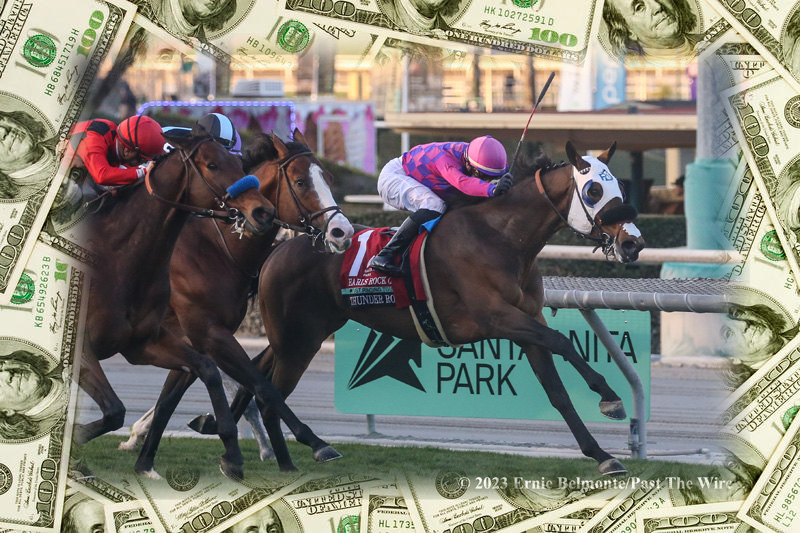
Photo by Ernie Belmonte/Past The Wire, Collage by Past The Wire
Thoroughbred Racing Economic Indicators
For March and First Quarter 2023
| March 2023 vs. March 2022 | |||
| Indicator | March 2023 | March 2022 | % Change |
| Wagering on U.S. Races* | $962,703,949 | $942,491,814 | +2.14% |
| U.S. Purses | $94,783,996 | $86,833,249 | +9.16% |
| U.S. Race Days | 294 | 291 | +1.03% |
| U.S. Races | 2,469 | 2,423 | +1.90% |
| U.S. Starts | 18,466 | 17,833 | +3.55% |
| Average Field Size | 7.48 | 7.36 | +1.62% |
| Average Wagering Per Race Day | $3,274,503 | $3,238,803 | +1.10% |
| Average Purses Per Race Day | $322,395 | $298,396 | +8.04% |
| 1st QTR 2023 vs. 1st QTR 2022 | |||
| Indicator | 1st QTR 2023 | 1st QTR 2022 | % Change |
| Wagering on U.S. Races* | $2,700,226,520 | $2,795,180,408 | -3.40% |
| U.S. Purses | $266,034,135 | $244,752,338 | +8.70% |
| U.S. Race Days | 822 | 807 | +1.86% |
| U.S. Races | 6,977 | 6,768 | +3.09% |
| U.S. Starts | 52,979 | 51,146 | +3.58% |
| Average Field Size | 7.59 | 7.56 | +0.48% |
| Average Wagering Per Race Day | $3,284,947 | $3,463,668 | -5.16% |
| Average Purses Per Race Day | $323,643 | $303,287 | +6.71% |
* Includes worldwide commingled wagering on U.S. races.


