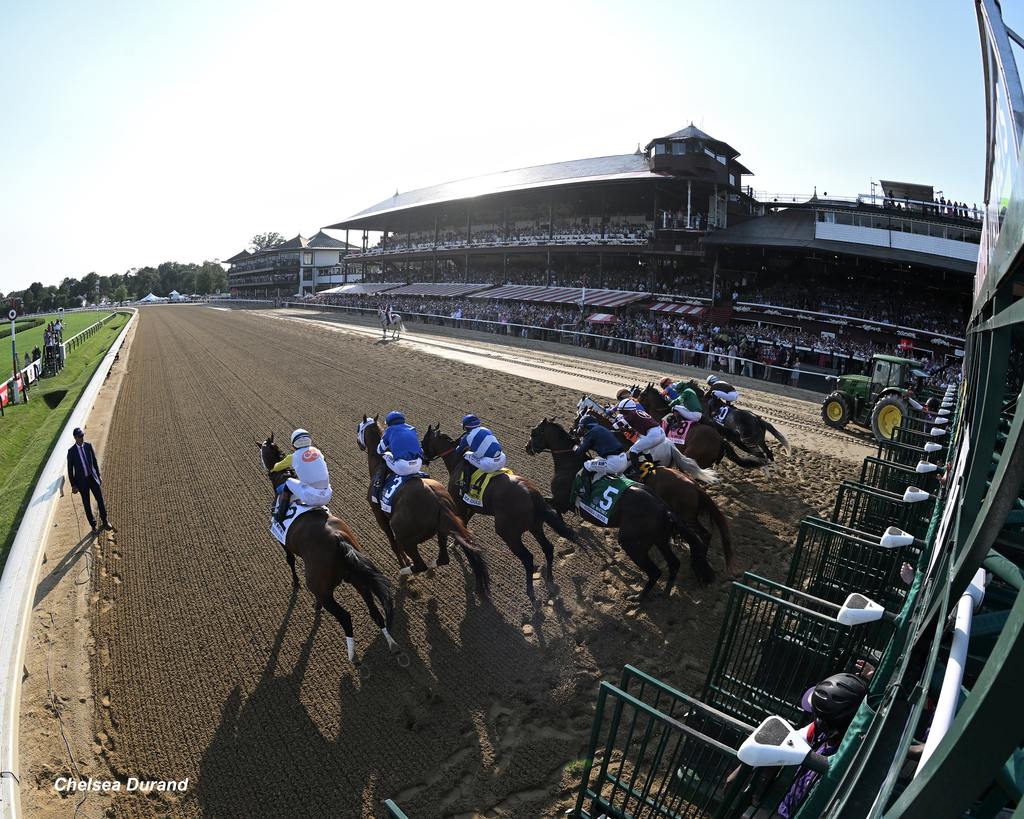
The start of the Whitney that generated record handle at Saratoga. (Chelsea Durand)
Equibase Release/Edited
With purses down almost 5% overall, the Thoroughbred Racing Economic Indicators for July look a bit bleak.
Race days dropped over 3% with races down over 4% and starts dropping over 6%.
All numbers were down with the exception of Average Wagering Per Race Day that increased over 2% from $2,514,789 to $2,571,489 a difference of $56,700.
These statistics are on par with the year-to-date numbers that are also down with the exception of field size and Average Available Purses Per Race Day.
Thoroughbred Racing Economic Indicators For July 2025
| July 2025 vs. July 2024 | |||
| Indicator | July 2025 | July 2024 | % Change |
| Wagering on U.S. Races* | $951,450,828 | $963,164,058 | -1.22% |
| U.S. Purses (Available) | $104,626,073 | $110,082,589 | -4.96% |
| U.S. Purses (Paid) | $100,967,210 | $106,015,727 | -4.76% |
| U.S. Race Days | 370 | 383 | -3.39% |
| U.S. Races | 2,903 | 3,042 | -4.57% |
| U.S. Starts | 20,276 | 21,651 | -6.35% |
| Average Field Size | 6.98 | 7.12 | -1.87% |
| Average Wagering Per Race Day | $2,571,489 | $2,514,789 | +2.25% |
| Average Available Purses Per Race Day | $282,773 | $287,422 | -1.62% |
| YTD 2025 vs. YTD 2024 | |||
| Indicator | YTD 2025 | YTD 2024 | % Change |
| Wagering on U.S. Races* | $6,737,934,638 | $6,914,682,270 | -2.56% |
| U.S. Purses (Available) | $694,069,693 | $718,796,197 | -3.44% |
| U.S. Purses (Paid) | $663,102,481 | $688,187,941 | -3.65% |
| U.S. Race Days | 2,082 | 2,173 | -4.19% |
| U.S. Races | 17,078 | 17,862 | -4.39% |
| U.S. Starts | 127,192 | 131,853 | -3.53% |
| Average Field Size | 7.45 | 7.38 | +0.89% |
| Average Wagering Per Race Day | $3,236,280 | $3,182,090 | +1.70% |
| Average Available Purses Per Race Day | $333,367 | $330,785 | +0.78% |
* Includes worldwide commingled wagering on U.S. races.


