J. Keeler Johnson/Kentucky Derby
What gate will your Kentucky Derby pick be starting from? How much does post position matter in the Kentucky Derby? What are the stats on who started from where?
The Kentucky Derby post position statistics have been meticulously compiled by Churchill Downs since the starting gate was first introduced for the 1930 Kentucky Derby.
How many winners have broken from post 1? What’s the win percentage of post 16? What percent of horses finish in the money (first, second, or third) when breaking from post 8? Who was the last horse to win from post 2? How about the last horse to finish in the money from post 18?
If you find yourself asking any of these questions, we’ve got you covered with a convenient chart breaking down all the data.
(Editor’s Note: There is one thing that flipped all of this data on its ear. Rich Strike in 2022 winning with the number 21 on his saddle cloth breaking from post 20. We will update the win and ITM percentage when available*.)
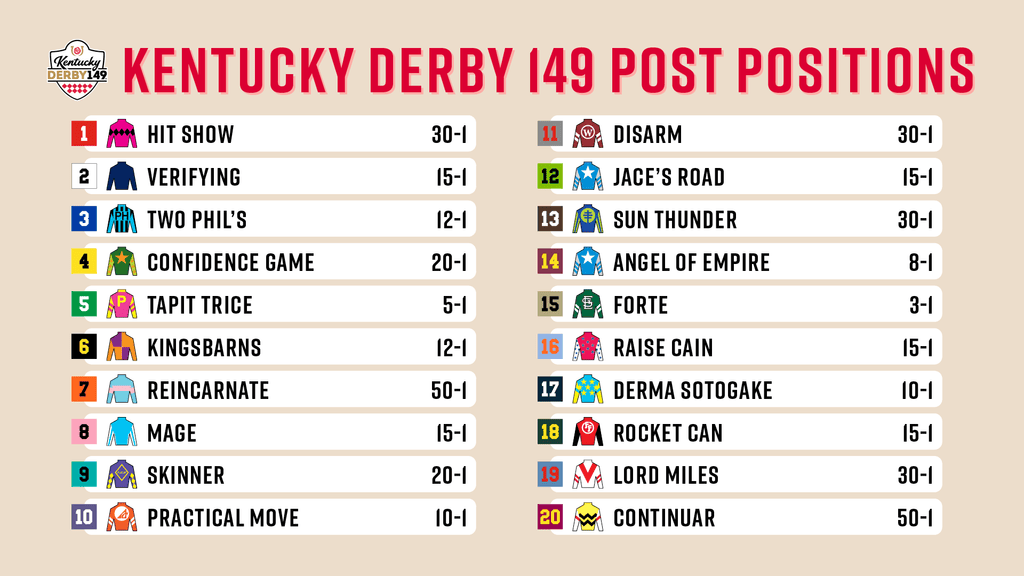
| Post | Derby Starter | Record | Win % | ITM % | Last Winner | Last ITM |
| 1 | Hit Show | 92-8-5-5 | 8.7% | 19.6% | Ferdinand (1986) | Lookin At Lee (2nd, 2017) |
| 2 | Verifying | 92-7-5-13 | 7.6% | 27.2% | Affirmed (1978) | Revolutionary (3rd, 2013) |
| 3 | Two Phil’s | 92-5-6-8 | 5.4% | 20.7% | Real Quiet (1998) | Golden Soul (2nd, 2013) |
| 4 | Confidence Game | 92-5-6-4 | 5.4% | 16.3% | Super Saver (2010) | Danza (3rd, 2014) |
| 5 | Tapit Trice | 92-10-8-4 | 10.9% | 23.9% | Always Dreaming (2017) | Audible (3rd, 2018) |
| 6 | Kingsbarns | 92-2-8-3 | 2.2% | 14.1% | Sea Hero (1993) | Good Magic (2nd, 2018) |
| 7 | Reincarnate | 91-8-6-6 | 8.8% | 22.0% | Mandaloun (2021) | Justify (1st, 2018) |
| 8 | Mage | 91-8-5-5 | 8.8% | 19.8% | Mine That Bird (2009) | Tacitus (3rd, 2019) |
| 9 | Skinner | 88-4-6-8 | 4.5% | 20.5% | Riva Ridge (1972) | Hot Rod Charlie (2nd, 2021) |
| 10 | Practical Move | 85-9-6-9 | 10.6% | 28.2% | Giacomo (2005) | Paddy O’Prado (3rd, 2010) |
| 11 | Disarm | 81-2-6-4 | 2.5% | 14.8% | Winning Colors (1988) | Code of Honor (2nd, 2019) |
| 12 | Jace’s Road | 77-3-3-3 | 3.9% | 11.7% | Canonero II (1971) | Afleet Alex (3rd, 2005) |
| 13 | Sun Thunder | 75-5-5-7 | 6.7% | 22.7% | Nyquist (2016) | Nyquist (1st, 2016) |
| 14 | Angel Of Empire | 65-2-6-6 | 3.1% | 21.5% | Carry Back (1961) | Essential Quality (3rd, 2021) |
| 15 | Forte | 60-6-2-1 | 10.0% | 15.0% | Authentic (2020) | Authentic (1st, 2020) |
| 16 | Raise Cain | 49-4-3-3 | 8.2% | 20.4% | Animal Kingdom (2011) | Commanding Curve (2nd, 2014) |
| 17 | Derma Sotogake (JPN) | 42-0-1-2 | 0.0% | 7.1% | None | Forty Niner (2nd, 1988) |
| 18 | Rocket Can | 34-2-4-0 | 5.9% | 17.6% | Country House (2019) | Country House (1st, 2019) |
| 19 | Lord Miles | 29-1-1-0 | 3.4% | 6.9% | I’ll Have Another (2012) | I’ll Have Another (1st, 2012) |
| 20 | Continuar (JPN) | 18-2-0-1 | * | * | Rich Strike (2022) | Big Brown (1st, 2008) |
*to be updated
A few key takeaways from the chart are as follows:
• Post 1 is often dreaded since it’s difficult for horses to secure racing room while breaking from the inside of a large field. But while post 1 hasn’t produced a Derby winner since Ferdinand in 1986, post 2, post 9, post 12, post 14, and post 17 have endured even worse luck. Post 14 hasn’t produced a Derby winner since Carry Back in 1961, and horses breaking from post 17 have gone 0-for-41.
• Not every Kentucky Derby features a full field, so inside posts are more likely to compile high win percentages than outside posts. In a 10-horse field, each post has a 10% chance at producing the winner. In a 20-horse field, each post has a 5% chance.
• Keeping the above in mind, it’s noteworthy how many Derby winners have broken from outside posts in recent years. Six of the last nine winners (67%) started from post 13 or wider, suggesting unencumbered trips are more important than saving ground in the Kentucky Derby.
• But based on a strict reading of the statistics, post 5 is the best position a horse can hope to draw. Not only has post 5 produced the most winners, the most runners-up, and the highest win percentage, it’s also produced a top-five finisher in every Kentucky Derby since 2012. This impressive streak includes the victorious duo of California Chrome (2014) and Always Dreaming (2017).


